
This week witnessed the effects of inaction ECB decision (Draghi keeps rates unchanged), stock market volatility, weaker US data, oil prices rally and uncertainty of FED rate hike. These kind of effects caused yield curves steeper in last 10 days.
Therefore, US, German and Japanese 2-10 year government bond yield curves are getting steeper in last 10 days. In other words, the gap between two-year and 10-year government bond yields has widened recently. A steepening yield curve is traditionally thought to signal an improving economy. The steep yield curve is an indicator of stronger economic activity and rising inflation expectations in the long term. In normal conditions, this steeper yield curves should be attractive and positive for the Fed decision about rate hike, but you need to see the big picture here. Fed is not looking at only these yields, but also they examine the historic relationship between bond yields, major stocks, inflation expectations, oil prices move and US dollar index. In addition, developments of China, Germany and Japan also affect the fed decision.
STEEP YIELD CURVE
A change in the yield curve where the spread between the yield on a long-term and short-term. Also known as the term structure of interest rates, yield curves are typically used depict the relationship between interest rates and the time to maturity of a debt security such as a bond. The shape of the curve provides the analyst-investor with insights into the future expectations for interest rates as well as possible increases or decreases in macroeconomic activity.
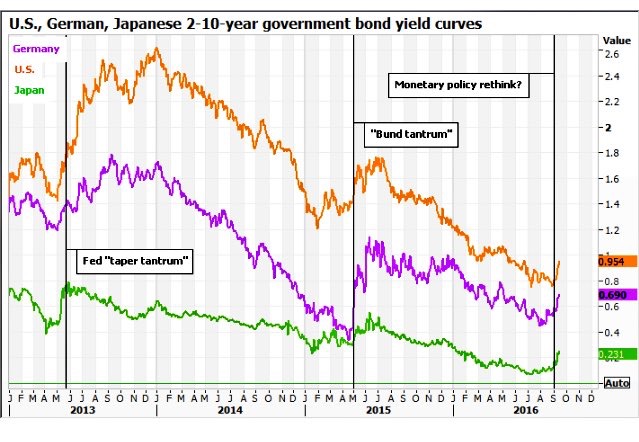
Graph Source : http://uk.reuters.com/article/us-global-bonds-curves-idUSKCN11L1W6
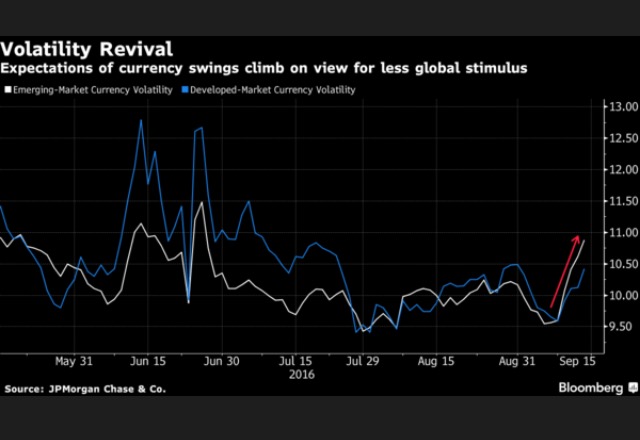
On the other side, On September 6, the Dow-Jones Industrial Average and the S&P 500 was around its historic high, and the NASDAQ index set a new historic high the day after. At the same time, volatility revival both in emerging and developed market currency.
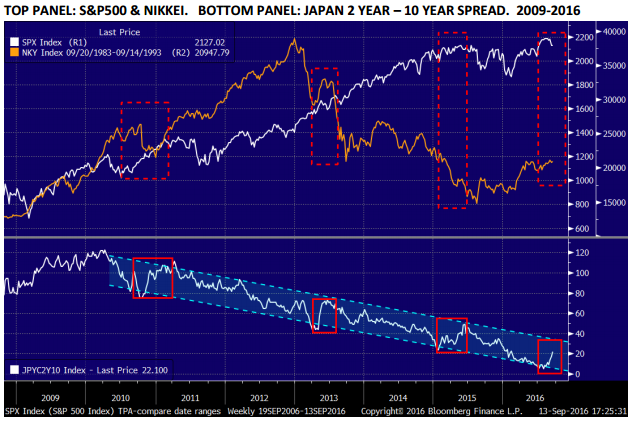
Interesting data from: http://www.benzinga.com/analyst-ratings/analyst-color/16/09/8457449/data-show-steeper-yield-curves-have-not-been-negative-fo
Data shows steeper yield curves have not been negative for stocks. The following chart that highlights three previous times the Japanese yield curve sharply steepened in the past eight years. Every other period of steepening other than the current one coincided with S&P 500 gains.
After all, this week comic from http://www.investing.com : Will Yellen kill the recent trend of spiking volatility or is it here to stay?


You must be logged in to post a comment.